
Benchmarking your CPU on Linux isn’t just for hardware enthusiasts; it’s a practical skill for developers, sysadmins, and anyone who wants to squeeze the most out of a machine. In this guide we’ll walk through everything you need to know—from installing reliable tools to interpreting the numbers—so you can make data‑driven decisions about upgrades, tuning, and workload placement.
What You’ll Need
- A Linux distribution with sudo privileges (Ubuntu, Fedora, Arch, etc.)
- Internet access to install packages and fetch benchmark suites
- Basic familiarity with the terminal
- Optional: a second system for comparative testing
Step 1: Install Benchmarking Tools
There are several well‑maintained benchmarking suites for Linux. The most popular are sysbench, stress-ng, and the cross‑platform Geekbench (free trial). For a thorough CPU profile we’ll install sysbench (synthetic tests) and stress-ng (stress‑test workloads). Open a terminal and run:
sudo apt update && sudo apt install -y sysbench stress-ngIf you’re on Fedora or Arch, replace apt with dnf or pacman -S respectively. Verify the installation:
sysbench --version
stress-ng --version
Both commands should return version strings without errors.
Step 2: Identify Your CPU
Before you start testing, capture the exact CPU model, core count, and frequency. This information provides context for the benchmark numbers and helps you compare apples‑to‑apples later.
lscpuTypical output includes fields such as Model name, CPU(s), Thread(s) per core, and CPU MHz. Save the output to a file for later reference:
lscpu > cpu_info.txtIf you need more granular details (like cache sizes), you can also inspect /proc/cpuinfo:
grep -E "model name|cache size|cpu cores" /proc/cpuinfo | uniqStep 3: Run Synthetic Benchmarks
Synthetic tests isolate raw integer and floating‑point performance. sysbench offers a built‑in cpu test that repeatedly calculates prime numbers. Start with a single‑threaded run to gauge per‑core capability:
sysbench cpu --cpu-max-prime=20000 --threads=1 runThe output ends with a line like total time: 12.3456s. Record this value. Next, scale the test to use all logical cores:
sysbench cpu --cpu-max-prime=20000 --threads=$(nproc) runCompare the total time with the single‑threaded result; the ratio indicates how well your CPU scales with parallelism. For floating‑point heavy workloads, sysbench also provides a fp test (available in newer releases) or you can use stress-ng with the --cpu‑method flag:
stress-ng --cpu 4 --cpu-method all --timeout 30s --metrics-briefThis command stresses four cores for 30 seconds and prints average MIPS (million instructions per second) and latency figures.
Step 4: Conduct Real‑World Workload Tests
Synthetic numbers are useful, but real applications often stress the CPU differently. Compile a sizable codebase (e.g., the Linux kernel) or run a language‑specific benchmark like pyperf for Python or go test -bench for Go. Here’s a quick example using the GNU C compiler to compile the Linux kernel source:
git clone https://github.com/torvalds/linux.git --depth 1
cd linux
make -j$(nproc) defconfig
time make -j$(nproc) all
The time command reports real, user, and sys times. The “real” value shows how long the compilation took on your hardware. Repeat the build after a clean make clean to ensure consistency.
Step 5: Analyze and Compare Results
Now that you have a collection of numbers—single‑core and multi‑core synthetic times, MIPS from stress-ng, and real‑world build duration—organize them in a table. Normalise values where possible (e.g., seconds per 10,000 primes) to make comparisons easier. If you have a reference system (perhaps an older laptop), place its numbers side‑by‑side to visualise performance gains.
Key things to look for:
- Scaling efficiency: Multi‑core time should be roughly
single‑core time / number_of_cores. Significant deviation suggests bottlenecks such as thermal throttling. - Consistency: Re‑run each test three times; large variance (>10%) may indicate background processes interfering.
- Thermal behavior: Monitor temperatures with
watch -n1 sensorswhile stressing; throttling will manifest as rising temps and slower runtimes.
Step 6: Document and Share Findings
Good documentation turns raw data into actionable insight. Include the following sections in your report:
- Hardware snapshot (output of
lscpuanddmidecode -t processor). - Benchmark methodology (tool versions, command line flags, runtime environment).
- Raw results (copy‑paste terminal output or CSV files).
- Analysis (scaling factor, thermal observations, comparison to baseline).
Save the report as Markdown or PDF and, if you’re part of a community, post it on forums or GitHub Gists. Transparency helps others reproduce your numbers and validates your conclusions.
Common Mistakes to Avoid
Even experienced users can trip over subtle pitfalls:
- Running benchmarks on a loaded system: Background services (updates, indexing, desktop effects) add noise. Switch to a console (Ctrl+Alt+F3) or use
systemd‑run --scope -p MemoryLimit=0 -p CPUQuota=100%to isolate the process. - Ignoring CPU frequency scaling: Modern CPUs boost and down‑clock dynamically. Disable turbo boost and set the governor to “performance” before testing:
sudo cpupower frequency-set -g performance
sudo cpupower frequency-set -d $(lscpu | grep "MHz" | head -1 | awk '{print $3}')
- Not cooling the CPU: Thermal throttling can silently halve performance. Ensure adequate airflow or use a cooling pad for laptops.
- Using the wrong core count:
$(nproc)reports logical cores, not physical ones. For hyper‑threaded CPUs, you may want to test both logical and physical core counts usinglscpu | grep "Core(s) per socket".
Tips and Tricks
Here are a few pro‑level shortcuts:
- Automate repeat runs: Wrap a benchmark in a loop and pipe output to
teefor logging:
for i in {1..5}; do sysbench cpu --cpu-max-prime=20000 --threads=$(nproc) run | tee -a bench_log.txt; done- Capture power consumption: If your hardware supports RAPL, use
perf stat -e power/energy-pkg/ -a -- sleep 30to record joules consumed during a stress test. - Benchmark in a container: Docker isolates libraries and ensures reproducibility. Example Dockerfile:
FROM ubuntu:22.04
RUN apt-get update && apt-get install -y sysbench stress-ng
CMD ["bash"]
Run docker run --rm -it --cpus="$(nproc)" mybench sysbench cpu --cpu-max-prime=20000 --threads=$(nproc) run to benchmark inside the container.
Frequently Asked Questions
Do I need root privileges to run these benchmarks?
Most CPU‑only tests (sysbench, stress‑ng) run fine as a regular user. However, changing the CPU governor or disabling turbo boost requires sudo. The commands shown include sudo where necessary.
How long should a benchmark run for reliable results?
A good rule of thumb is at least 30 seconds for synthetic tests and 2–3 minutes for stress‑tests. Longer runs expose thermal throttling and power‑saving quirks that short bursts miss.
Can I compare results across different Linux distributions?
Yes, but be aware that default kernel versions, compiler flags, and background services differ. Document the distro, kernel version (uname -r), and any custom tweaks to make the comparison fair.
Conclusion
Benchmarking CPU performance on Linux is a systematic process: install trusted tools, gather hardware details, run both synthetic and real‑world tests, analyse scaling and thermal behavior, and finally document everything clearly. By avoiding common mistakes—like testing on a busy system or ignoring frequency scaling—and applying the tips above, you’ll obtain trustworthy numbers that guide hardware upgrades, kernel tuning, and workload placement. Happy benchmarking!
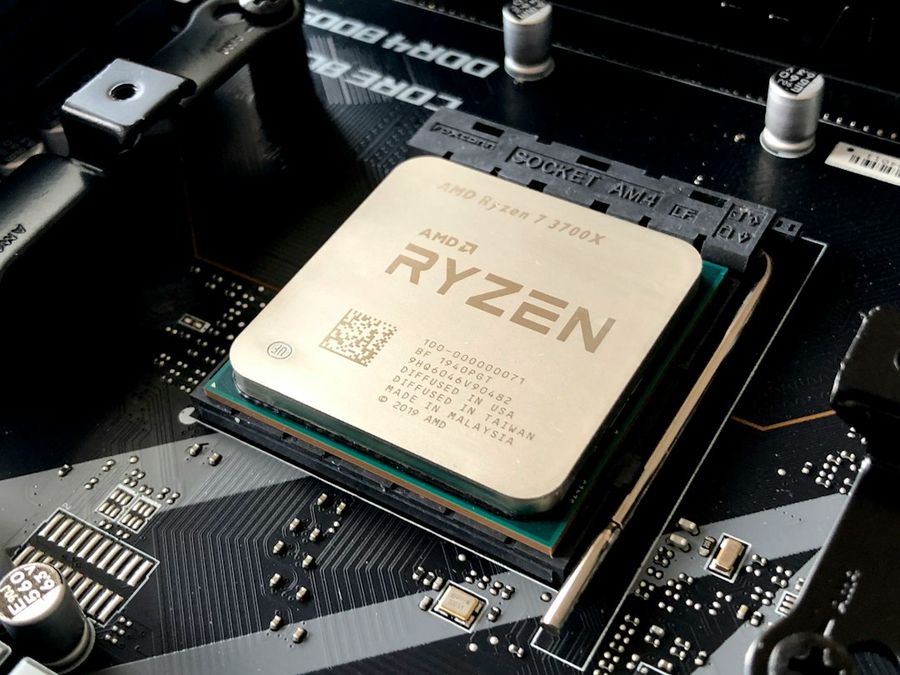
Photo by Olivier Collet on Unsplash


